Exploratory Data Analysis and Hypothesis Testing - Loan Prediction
Problem Statement:
About Company
Dream Housing Finance company deals in all home loans. They have presence across all urban, semi urban and rural areas. Customer first apply for home loan after that company validates the customer eligibility for loan.
Problem
Company wants to automate the loan eligibility process (real time) based on customer detail provided while filling online application form. These details are Gender, Marital Status, Education, Number of Dependents, Income, Loan Amount, Credit History and others. To automate this process, they have given a problem to identify the customers segments, those are eligible for loan amount so that they can specifically target these customers.
Introduction
The objective of this project is to do “Exploratory Analysis” and “Hypothesis Testing” on the features of this dataset to find various insights as to how each feature affects the chances of getting a loan.
Dataset
The Loan Prediction dataset consists of 613 customer details and 13
features.
Variable
|
Description
|
Loan_ID
|
Unique Loan ID
|
Gender
|
Male/ Female
|
Married
|
Applicant married (Y/N)
|
Dependents
|
Number of dependents
|
Education
|
Applicant Education (Graduate/ Under
Graduate)
|
Self_Employed
|
Self employed (Y/N)
|
ApplicantIncome
|
Applicant income
|
CoapplicantIncome
|
Coapplicant income
|
LoanAmount
|
Loan amount in thousands
|
Loan_Amount_Term
|
Term of loan in months
|
Credit_History
|
credit history meets guidelines
|
Property_Area
|
Urban/ Semi Urban/ Rural
|
Loan_Status
|
Loan approved (Y/N) --> Target Variable
|
SECTION 1:
Exploratory Data Analysis
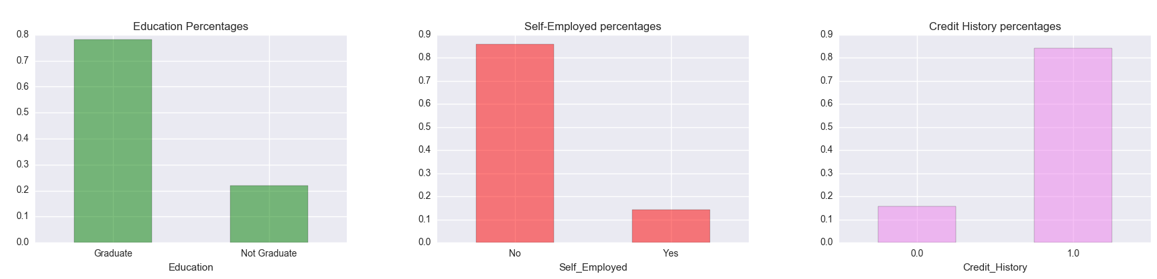
1.1 Univariate Analysis
Categorical
Features:


Numerical Features:
1. Applicant Income:


2. Coapplicant
Income:

3. Loan Amount:


1.2 Bivariate and Multivariate Analysis
Categorical Features:
Categorical Features:
1. Property Area vs Loan Status:
“Question: is there an
association between getting a Loan and the Property Area?”

Since, P(A) != P(A/B), we can conclude that there is an
association between getting a loan and the property area. The probability of
getting a loan, regardless of property
area, is 68.7%.
However,
examination of a contingency table containing both Loan Status and Property
area showed that the conditional probability of getting a loan changes by
property area.
Visual
examination of the barplot shows the conditional probabilities of getting a loan
are not equal across Property areas.
2. Credit History vs Loan
Status:
“Question: is there an association between getting a Loan and Credit History?”
“Question: is there an association between getting a Loan and Credit History?”

Since, P(A) != P(A/B), there is an association between
getting a loan and the credit history. The probability of getting a loan,
regardless of credit history, is 68.7%.
However,
conditional probability showed that getting a loan changes by credit history.
From
the barplot, it is very clear that those customers who have a credit card
stands a better chance for getting a loan. We will do some statistical tests to
confirm this assumption
later on this project.
3. Education vs
Loan Status:
“Question: is there an association between getting a
Loan and Education?”

Since, P(A) != P(A/B), we can assume that there
is an association between getting a loan and the Education. Although, the
difference is just 9%, a statistical test would be helpful to confirm this assumption.
4. Loan Amount
Term vs Loan Status:
“Question: is there an association between getting a Loan and Loan Amount Term?”
“Question: is there an association between getting a Loan and Loan Amount Term?”

Since, P(A) != P(A/B), there seems to be an association. This needs to be confirmed
with some statistical tests.
NOTE: Loan Term was divided into 3 bins:
low[0-160 months], medium[160-320 months], high[320-500 months]
low[0-160 months], medium[160-320 months], high[320-500 months]
5. Dependents VS Loan Status:
“Question: is there an association between getting a Loan and Dependents?”
“Question: is there an association between getting a Loan and Dependents?”
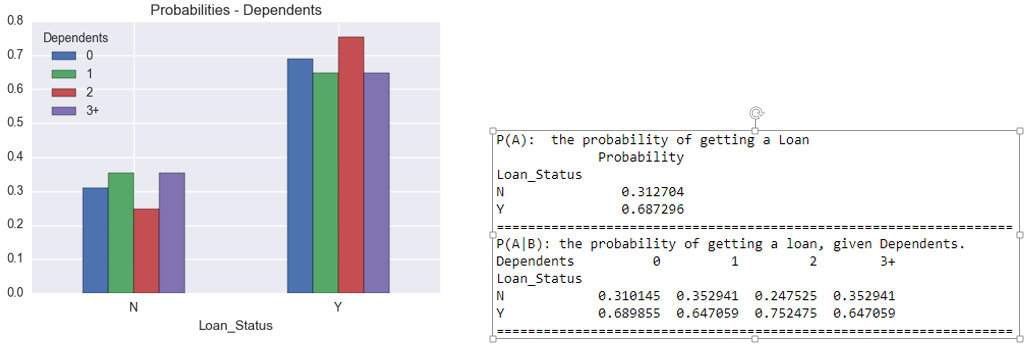
For
Dependents == 0, P(A) = P(A/B), whereas, others seems to have an association.
6. Self Employed vs Loan Status:
“Question: is there an association between getting a Loan and Self Employment?”
“Question: is there an association between getting a Loan and Self Employment?”

Since P(A)
is almost equal to P(A/B). Our initial assumption would be that there is no
association between these two.
Need to
conduct a statistical test to confirm.
7. Gender vs Loan Status:
“Question: is there an association between getting a Loan and Gender?”
“Question: is there an association between getting a Loan and Gender?”

Since
P(A) and P(A/B) are almost equal, we would assume that there is no association
between these two. A statistical test would confirm our assumption.
8. Married vs Loan Status:
“Question: is there an association between getting a Loan and Married?”
“Question: is there an association between getting a Loan and Married?”

There
is a difference of around 9%, so we would assume that there is an association.
A statistical test would confirm their significance.
Numerical Features:
1. ApplicantIncome,
CoApplicantIncome vs LoanAmount:
“Question: Does
Loan Amount applied increases with increase in Applicant & Co-Applicant
Incomes?”

Correlation factor for ApplicantIncome and LoanAmount
accounts for 0.57, whereas for Co-applicant Income, it is very poor [just
0.18].
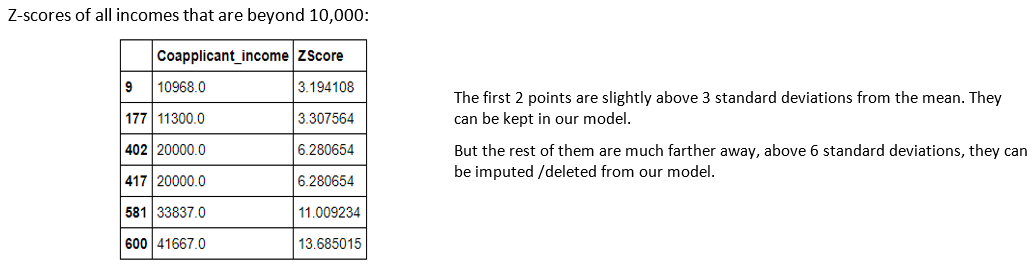
As we saw in Univariate analysis, there were few outliers, i.e.
observations having standard deviations higher than 3. Lets delete those and
recheck the correlation factors.

We
can only see a slight improvement for Co-applicant Income, increasing to 0.26,
whereas for ApplicantIncomes, it decreased by 0.05
Numerical
– Categorical Features:
1. LoanAmount, ApplicantIncome,
Co-ApplicantIncome vs Loan Status:
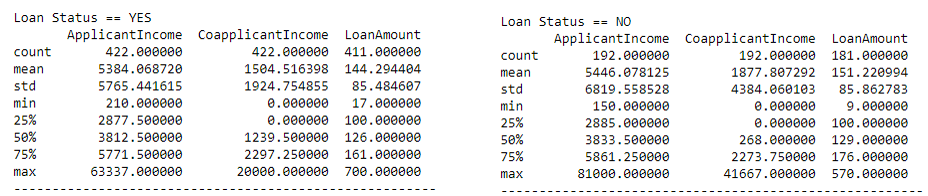
By comparing both summaries, it is seen that there is no
enough evidence that getting a loan or not getting a loan is purely based on
Income Range or loan amount,as the means are almost same.
Although the standard deviations varies a lot, this is due to variation
in count.
We need to conduct some statistical tests to determine whether there is
actually any significance between the two groups.
2. Education VS Applicant Income:
“Question: Does Graduates have higher chances of getting a high Salary?”

SECTION 2:
Hypothesis Testing
1. Property Area
vs Loan Status:
As we saw in Bivariate Analysis that the conditional
probability of getting a loan is not equal across different property area.
So now we need to conduct a
statistical test to confirm this assumption.
Null hypothesis:
every property area has equal chances of getting a loan; [m1 == m2]
Alternate hypothesis :
not equal chances; [m1 != m2]

2. Credit History vs Loan Status:
As we saw in Bivariate Analysis that the conditional probability of getting a loan is not equal across different credit history.
Null hypothesis : equal chances of getting a loan for different credit history
Alternate hypothesis : not equal chances

3. Education vs Loan Status:
We
assumed that there is an association between getting a loan and Education, with
a difference of just 9% in conditional probabilities.
Null hypothesis : equal chances of getting a loan
for different education background
Alternate hypothesis : not equal
chances

4. Dependents vs
Loan Status:
Earlier
we found that except dependents = 0, others had an association with Loan
Status.
Null hypothesis : equal chances of getting a loan
for different no. of Dependents
Alternate hypothesis : not equal
chances

5. Loan Amount
Term vs
Loan Status:
Earlier
we divided the Loan Amount Term into 3 categories and through bivariate tests
we assumed that there is actually an association with getting a loan.
Lets confirm
that assumption.
Null
hypothesis : equal chances of getting a loan
for different Loan Term
Alternate hypothesis : not equal
chances

6. Self
Employed vs Loan Status:
Earlier
we assumed that there is no association between Self_Employed and Loan Status.
Null hypothesis : equal chances of getting a loan
for Self_employment
Alternate hypothesis : not equal
chances

7. Gender vs
Loan Status:
Null
hypothesis : equal chances of
getting a loan for Gender
Alternate
hypothesis : not equal chances

8. Married vs
Loan Status:
Earlier
we saw that probability of getting a loan for married people was high by around
9%.
Null
hypothesis : equal chances of
getting a loan for Married
Alternate
hypothesis : not equal chances

9. ApplicantIncome,
CoapplicantIncome, LoanAmount vs LoanStatus:
As we saw in bivariate analysis, there is no enough evidence that getting a loan or not getting a loan
is purely based on Income Range or loan amount, as the means are almost same. Lets conduct t-test taking
into account the incomes and loan amounts against loan status.
Null Hypothesis : customers with loan_status
== yes and those whose loan_status == no, have equal mean Applicant Income /Coapplicant
Income/LoanAmount
Alternate hypothesis : not equal mean

In
all the above cases, we fail to reject the null hypothesis as p-values >
0.05
Conclusion:
We did Exploratory data
Analysis on the features of this dataset and saw how each feature is
distributed. We also calculated probabilities to prove an association among the
Independent variables and the Target variable. And based on the results, we
assumed whether or not there is an association.
Lastly, Statistical Tests
were conducted so as to confirm or deny the assumptions we made.


Comments
Post a Comment