A/B Testing: Bernoulli Model VS the Beta-Binomial Hierarchical Model

What is A/B Testing?
A/B testing is a method of comparing two versions of a webpage or app against each other to determine which one performs better.
AB testing is essentially an experiment where two or more variants of a page are shown to users at random, and based on the data it receives, statistical analysis is used to determine which variation performs better for a given conversion goal.

How A/B Testing works?
Here, 2 variations of the same webpage or app are created and are randomly assigned to the users (say 50% to Variation A and 50% to Variation B). As users are served either the A or B, their engagement with each variation is measured and collected and analyzed through a statistical engine. You can then determine whether changing the webpage or app experience had a positive, negative, or no effect on user behavior.
Why A/B Testing should be used?
A/B testing allows individuals, teams, and companies to make careful changes to their user experiences. This allows them to construct hypotheses, and to learn better why certain elements of their experiences impact user behavior.
AB testing can be used to continuously improve a given experience, improving on a single goal like conversion rate over time.
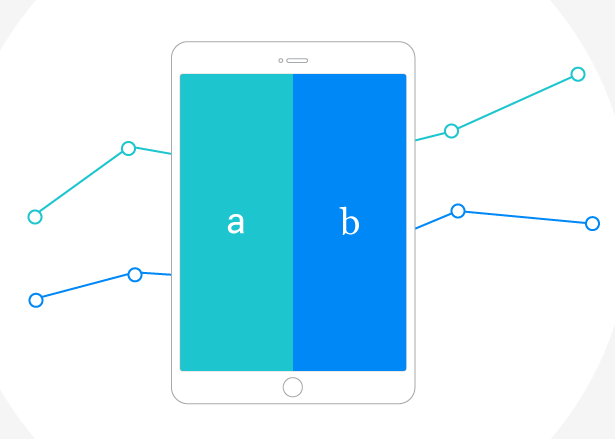
For example: Suppose there are 2 variations of a webpage. "A" and "B" has green & blue background colors respectively.
Now, our job is to find which webpage will give us more conversion rate (more sign-ups).
This is how A/B Testing helps us to achieve our goal.

In this blog, I will discuss 2 types of A/B Testing:
1. Bernoulli models
2. Beta-Binomial Hierarchical models
A. Bernoulli Models
Bernoulli models are used to compare performance between 2 webpage or apps.

Process:
1. We can model each possible sign-up as a Bernoulli event. Recall the Bernoulli distribution reflects the outcome of a coin flip. With some probability p, the coin flips head and with probability 1-p, the coin flips tails. The intuition behind this model is as follows: A user visits the website. The user flips a coin. If coin lands head, the user signs up.
Now, let’s say each website has its own coin. Website A has a coin that lands heads with probability pA, and Website B has a coin that lands heads with probability pB. We don’t know either probabilities, but we want to determine if pA < pB or pA > pB.
Note: There is also possibility of pA = pB, i.e. both variations are same.
2. Here, the information related to the true values (i.e. probabilities of being website A or B) are not known. So, we will draw the distribution from a Uniform distribution.
Why Uniform distribution?
Because we do not know the true values of either website, so we assume that both the websites have equal chances or probabilities.
Uniform distribution gives us the uniformity for both the websites.
3. Now, we will create the posterior distributions for the difference of the 2 distributions (i.e. distribution of A and B).
Posterior Distributions = Prior Probability + new evidence/information
Prior probability: observed rate of an event.
Let's say, people with more than 2 years of experience tends to earn 20% more salary than people with no experience. This is the observed rate based on, lets say 1000 employees.
New evidence: new data collected about the same event, which changes the observed rate entirely.
Let's say, more employees were analyzed which changed the rate from 20% to 30%.
Here, the posterior distribution will be the difference of the 2 events: pB - pA
If pB > pA then the graph will lie to the right side of the black line (representing where the difference between the two distributions is 0) at x = 0.

Disadvantages:
Bernoulli models works well when it comes to comparing the performance between 2 webpage or apps. But for more than 2, we risk getting false positives.
But how?
Say we have 5 variations of the same webpage, then the possible pairs we will get is 10.
So when we test all possible pairs independently at alpha = 0.05, for each test there is a
95% chance of not getting a false positive.
So, the probability of not getting a false positive for all 10 pairs: (0.95)10 = 60%
That means, 40% of the time we will get false positives.
NOTE: Why false positive?
Bernoulli distribution has only 2 outcomes: 0 or 1, i.e. either one is possible.
If it is actually variation A, but we say that it is variation B then it is wrongly declared the winner, i.e. False positive.
Again if it is actually variation B, but we say that it is variation A then it is wrongly declared the winner, i.e. False positive.
Solution to this problem: Beta-Binomial Hierarchical Model
B. Beta-Binomial Hierarchical Model
When there are more than 2 variations of the same webpage or apps, this model helps us to compare their performance without raising the possibility of false positives, as seen for the Bernoulli model.

What is Beta-distribution?
If we look at the Uniform Distribution, it assigns equal probabilities to all points in the domain (0,1). But what if we want a distribution over (0,1)?
That is when Beta-distribution comes into play.
Beta-distribution can be seen as a generalization of the Uniform (0,1) distribution, as it allows us to define more PDF over the interval (0,1).
In probability theory and statistics, the beta distribution is a family of continuous probability distributions defined on the interval [0, 1] with two positive shape parameters, denoted by α and β, that appear as exponents of the random variable and control the shape of the distribution.
In Bayesian inference, the beta distribution is the conjugate prior probability distribution for the Bernoulli, binomial and geometric distributions. For example, the beta distribution can be used in Bayesian analysis to describe initial knowledge concerning probability of success such as the probability that a visit to a webpage will successfully complete a sign-up.

Where B is the normalization factor and the beta- function of (α, β). By changing the values of α and β, we can change the shape and the “steepness” of the distribution, thus allowing us to easily create a wide variety of functions over the interval (0,1).

How does it help?
It helps us to create prior distributions and informative priors that is very much useful for A/B Testing.
It helps us to create prior distributions and informative priors that is very much useful for A/B Testing.
What is Binomial distribution?
A distribution where only 2 outcomes are possible, i.e. 0 or 1 for 'n' number of trials.
Here, each trial is independent.
The parameters of Binomial distribution are: n = number of trials and p = probability of success.
This is how the posterior distributions looks like.

We can easily compute the difference between any two of them and plot them as follows.

Here, each trial is independent.
The parameters of Binomial distribution are: n = number of trials and p = probability of success.
Hierarchical Model
So how do we actually use Binomial and Beta distributions here?
1. The main intuition behind Binomial (0,1) distribution is that if we flip a coin with probability p of landing heads n times, how likely is it that we see k heads for some k between 0 and n.
So, to model the number of sign-ups, we use Binomial Distribution.
2. In Bernoulli Model, we did not have prior information about the true rates for each website, so we used Uniform(0,1) as our uninformative prior.
In this case, the true sign-up rate for each website, pi, is drawn from Beta(α, β).

We can easily compute the difference between any two of them and plot them as follows.


Comments
Post a Comment