Exploratory Data Analysis and Hypothesis Testing - Big Mart Sales

Aim:
The purpose of this post is to deal with Exploratory Data Analysis and Hypothesis testing of the Big Mart Sales dataset.This is the first step to my machine learning problem on predicting sales. So, all the changes and transformations that will be done in this post will be mainly focused on how to make life easier for my models to predict sales.
Dataset:
This dataset contains 8523 observations and 12 features.
| Variable | Description |
|---|---|
| Item_Identifier | Unique product ID |
| Item_Weight | Weight of product |
| Item_Fat_Content | Whether the product is low fat or not |
| Item_Visibility | % of total display area in store allocated to this product |
| Item_Type | Category to which product belongs |
| Item_MRP | Maximum Retail Price (list price) of product |
| Outlet_Identifier | Unique store ID |
| Outlet_Establishment_Year | Year in which store was established |
| Outlet_Size | Size of the store |
| Outlet_Location_Type | Type of city in which store is located |
| Outlet_Type | Grocery store or some sort of supermarket |
| Item_Outlet_Sales | Sales of product in particular store. This is the outcome variable to be predicted. |
Hypotheses Testings
Categorical Features:
- Item_Fat_Content
- Item_Type
- Outlet_Size
- Outlet_Type
- Outlet_Location_Type
Question:
What is the distribution of each categorical feature? And does each item in that feature has a statistically significant mean difference w.r.t the response variable, i.e. "Item_Outlet_Sales"?
Numerical Features:
- Item_Weight
- Item_Visibility
- Item_MRP
- Outlet_Establishment_Year
Question:
What is the correlation of each numerical feature with the response variable? And how much does it effect sales?
Item_Fat_Content:

 Null Hypothesis: There is no difference in the means of the groups
Alternate : There is a difference
Null Hypothesis: There is no difference in the means of the groups
Alternate : There is a difference
 With p-value > 0.05, we fail to reject the null hypothesis and conclude that there is no difference between the groups.
Item_Type:


Null Hypothesis: There is no difference in the means of the groups
Alternate : There is a difference

Overall p-value < 0.05, so we reject the null hypothesis and conclude that atleast 1 group's mean is different from the others.
Also, tukey test confirmed that only the mean difference between drinks and food is significantly different.
Now, the meandiff between [drinks & nc] and [food & nc] are 145 and 72 respectively. Since differnce between food and nc are much lower, so both these groups will be grouped together and ANOVA test will be conducted again.

with p-value < 0.05, we have a significant difference between these 2 groups.
Outlet_Size:


Null Hypothesis: There is no difference in the means of the groups
Alternate : There is a difference

Although we have an overall significance with p-value < 0.05, from tukey test we got that only mean difference between [high & medium] is not significant. So, these groups will be grouped together.

with p-value < 0.05, we have a significant difference between these 2 groups.
Outlet_Type:

Question:
What is the correlation of each numerical feature with the response variable? And how much does it effect sales?
Item_Fat_Content:


Null Hypothesis: There is no difference in the means of the groups
Alternate : There is a difference

With p-value > 0.05, we fail to reject the null hypothesis and conclude that there is no difference between the groups.


Null Hypothesis: There is no difference in the means of the groups
Alternate : There is a difference

Overall p-value < 0.05, so we reject the null hypothesis and conclude that atleast 1 group's mean is different from the others.
Also, tukey test confirmed that only the mean difference between drinks and food is significantly different.
Now, the meandiff between [drinks & nc] and [food & nc] are 145 and 72 respectively. Since differnce between food and nc are much lower, so both these groups will be grouped together and ANOVA test will be conducted again.

with p-value < 0.05, we have a significant difference between these 2 groups.
Outlet_Size:


Null Hypothesis: There is no difference in the means of the groups
Alternate : There is a difference

Although we have an overall significance with p-value < 0.05, from tukey test we got that only mean difference between [high & medium] is not significant. So, these groups will be grouped together.

with p-value < 0.05, we have a significant difference between these 2 groups.


Null Hypothesis: There is no difference in the means of the groups.
Alternate : There is no difference

Outlet_Location_Type:


Null Hypothesis: There is no difference in the means of the groups
Alternate : There is a difference

Overall p-value < 0.05. Tier 2 and Tier 3 does not have a significant difference. So, same as before, grouping them together.
New ANOVA test:

With p-value < 0.05, we have a significant difference between these 2 groups.

Correlation = 0.012 -----> figure 1
Since, the correlation between Item_Weight and the response variable is very less, merely 1.2%, this is not going to help in our prediction.
Lets break this into 3 groups:[0 - 25th percentile - 75th percentile - 100th perentile] ----> figure 2 and figure 3


 Correlation: -0.12 -----> figure 1
Since, the correlation between Item_Visibility and the response variable is very less, negative 12%, this is not going to help in our prediction.
Lets break this into 3 groups:[0 - 25th percentile - 75th percentile - 100th perentile] ----> figure 2 and figure 3


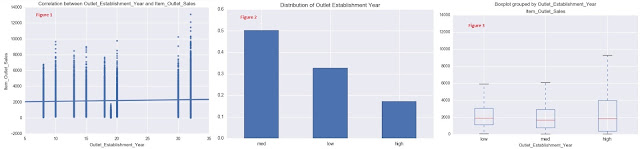
Correlation: 0.049 -----> figure 1
Since, the correlation between Item_Visibility and the response variable is very less, negative 4.9%, this is not going to help in our prediction.
Lets break this into 3 groups:[0 - 25th percentile - 75th percentile - 100th perentile] ----> figure 2 and figure 3


Since, the correlation between Item_Weight and the response variable is very less, merely 1.2%, this is not going to help in our prediction.
Lets break this into 3 groups:[0 - 25th percentile - 75th percentile - 100th perentile] ----> figure 2 and figure 3

Null Hypothesis: There is no difference in the means of the groups
Alternate : There is a difference

Overall p-value < 0.05. high and low weights does not have a significant difference. So, same as before, grouping them together.
New ANOVA test:

With p-value < 0.05, we have a significant difference between these 2 groups.
Item_Visibility:

Since, the correlation between Item_Visibility and the response variable is very less, negative 12%, this is not going to help in our prediction.
Lets break this into 3 groups:[0 - 25th percentile - 75th percentile - 100th perentile] ----> figure 2 and figure 3

Null Hypothesis: There is no difference in the means of the groups
Alternate : There is a difference

Overall p-value < 0.05. "low" and "med" visibility does not have a significant difference. So, same as before, grouping them together.
New ANOVA test:

With p-value < 0.05, we have a significant difference between these 2 groups.
Item_MRP:

Correlation: 0.567
In this case, correlation between Item_MRP and the response variable is good, with 56.7%, i.e. with increase in $1 in item_mrp, outlet sales tend to increase by little more than half of that amount.
Outlet_Establishment_Year:

Since, the correlation between Item_Visibility and the response variable is very less, negative 4.9%, this is not going to help in our prediction.

Null Hypothesis: There is no difference in the means of the groups
Alternate : There is a difference

With p-value < 0.05, we have a significant difference between these groups.
Conclusion:
In this post we did Exploratory Analysis of all features and then saw how each feature is distributed and how they affect sales.
According to the findings, transformations were done wherever needed.
Now, when it comes to predictive sales, we found that in "Item_Fat_Content", both groups does not have a statistically significant mean difference. So, it will be excluded from our predictive models.
Follow the Predictive Analysis post here ---> Click here


Comments
Post a Comment